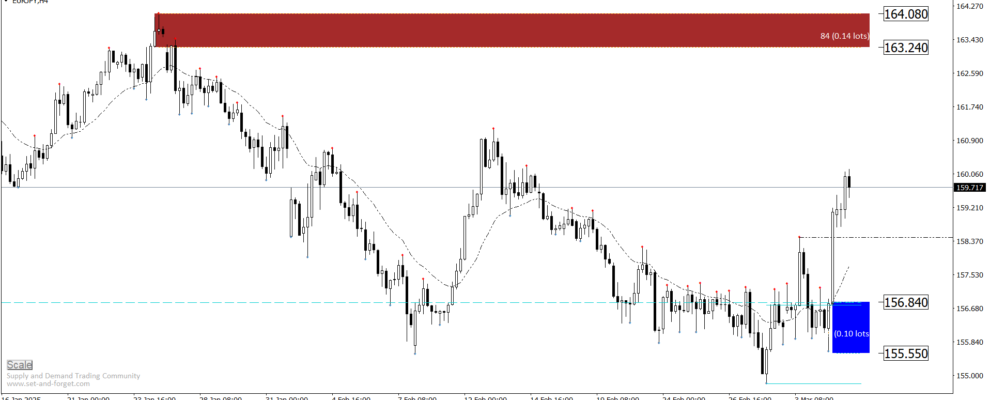
On H4 chart, EURJPY managed to break the previous high and created a new demand zone around 155.550-156.840 levels. On H1 chart, I highlighted two interesting demand zones: one around 38% fib (157.880-158.330) and the second zone around 61 and 78% fib (155.980-156.910). If price tests one of these zones and shows enough bullish evidence, we go long. …
Category: Technical Analysis
On the H4 chart, price retested the demand zone around 1.04460-1.04630 and showed some bullish evidence to the upside. If this zone holds and price continues to show bullish momentum, …

On the H4 chart, EURAUD broke previous low around 1.6503 and is moving down to test the fresh demand zone around 1.62640 and 1.63200 levels. If price tests this zone …

USDCAD on H1 chart broke the previous high and retested the demand zone around 1.4269-1.4299 levels. If this zone holds, we go long with a potential target at 1.4746 level. …

AUDUSD in 30 minute-chart shows a great selling opportunity as price broke previous low and failed to break previous high confirming a short bias on AUDUSD. There are three potential …
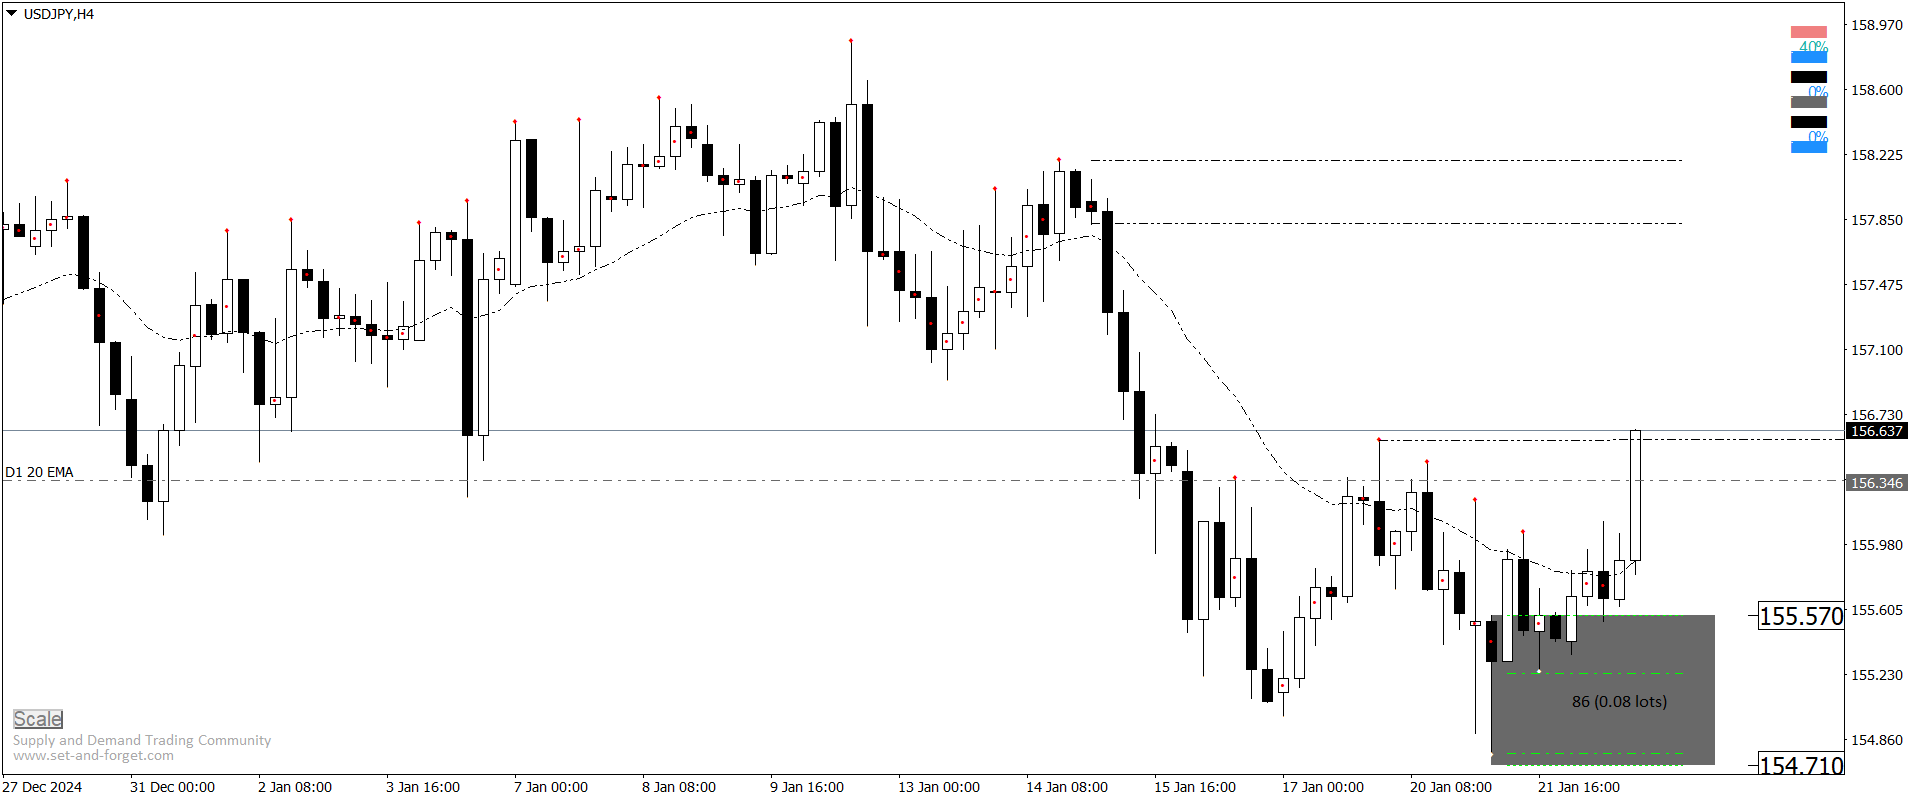
On H4 chart, USDJPY finally broke the previous high and confirmed a bullish momentum pushing price higher. If price retraces back down to the demand zone around 154.710-155.570 levels and …
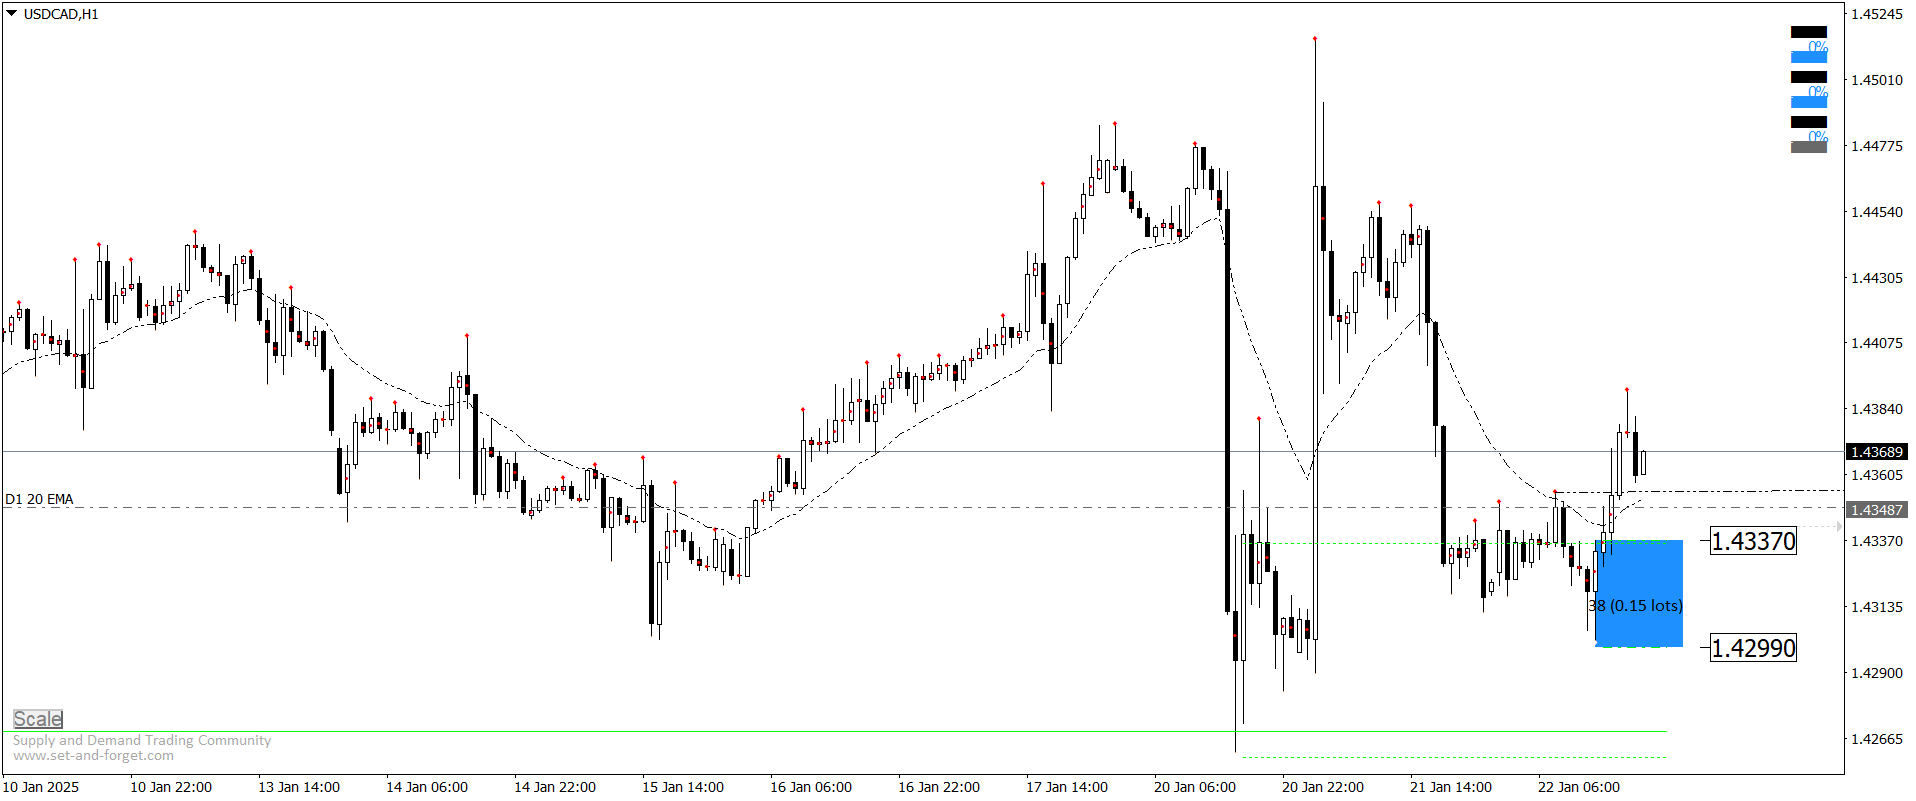
On H1 chart, USDCAD managed to break above previous high confirming a bullish momentum to the upside. If price retraces back to the newly formed demand zone around 1.42990-1.43370 levels, …
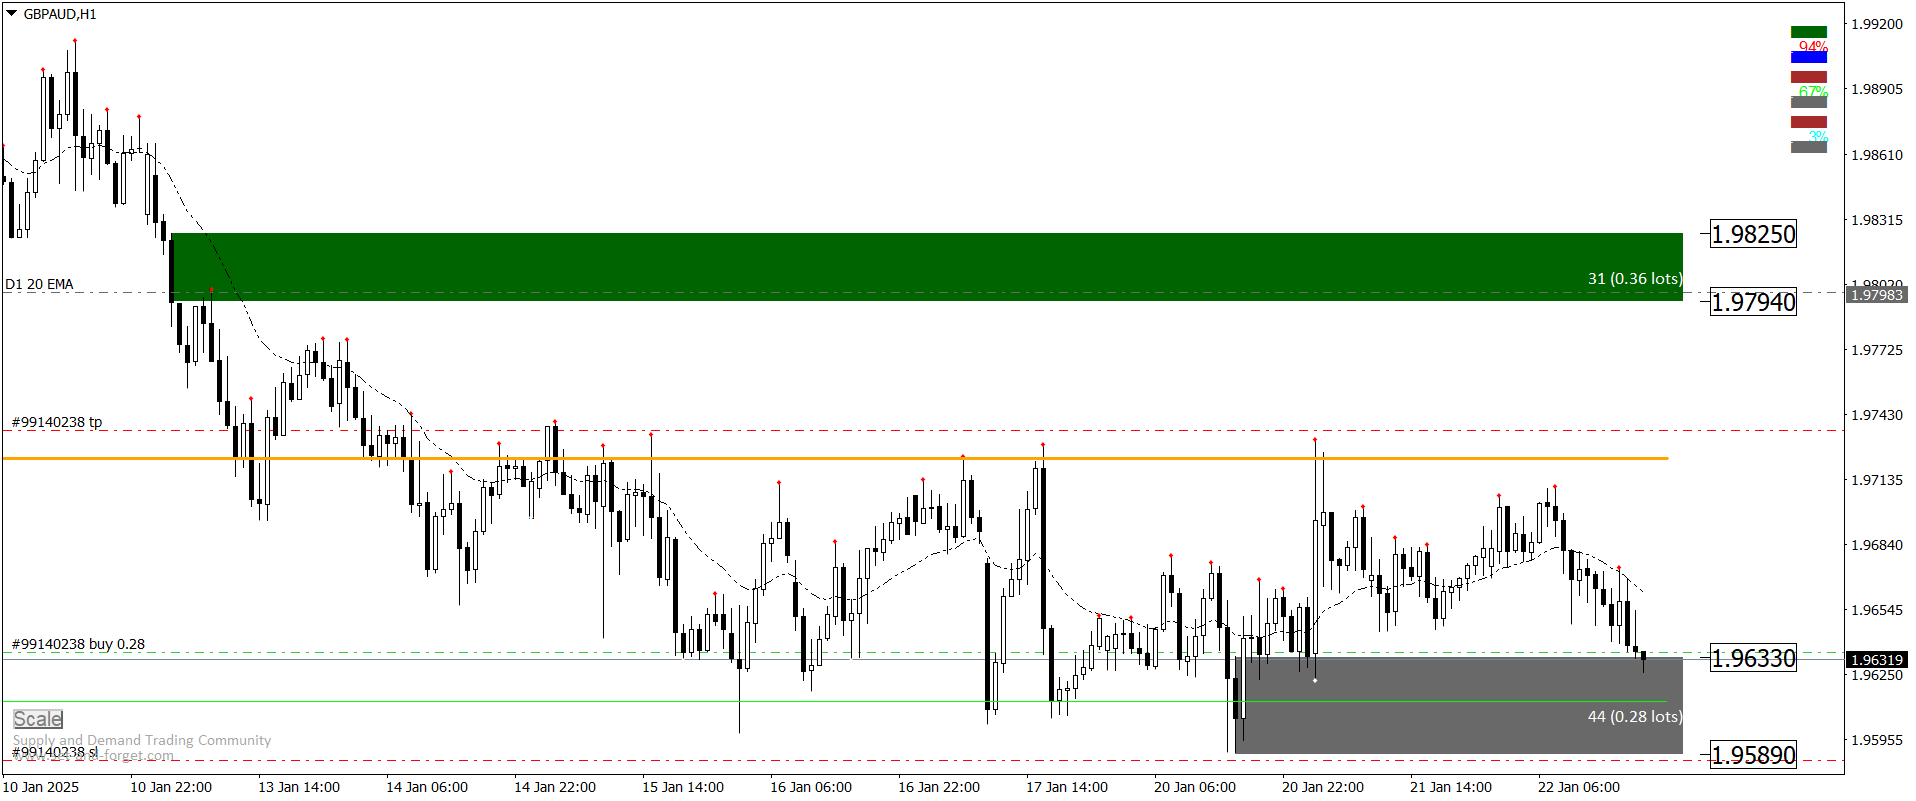
On the H1 chart, GBPAUD broke previous high and retested the demand zone around 1.95890-1.96330 levels. If this demand zone is respected, price will go all the way up to …
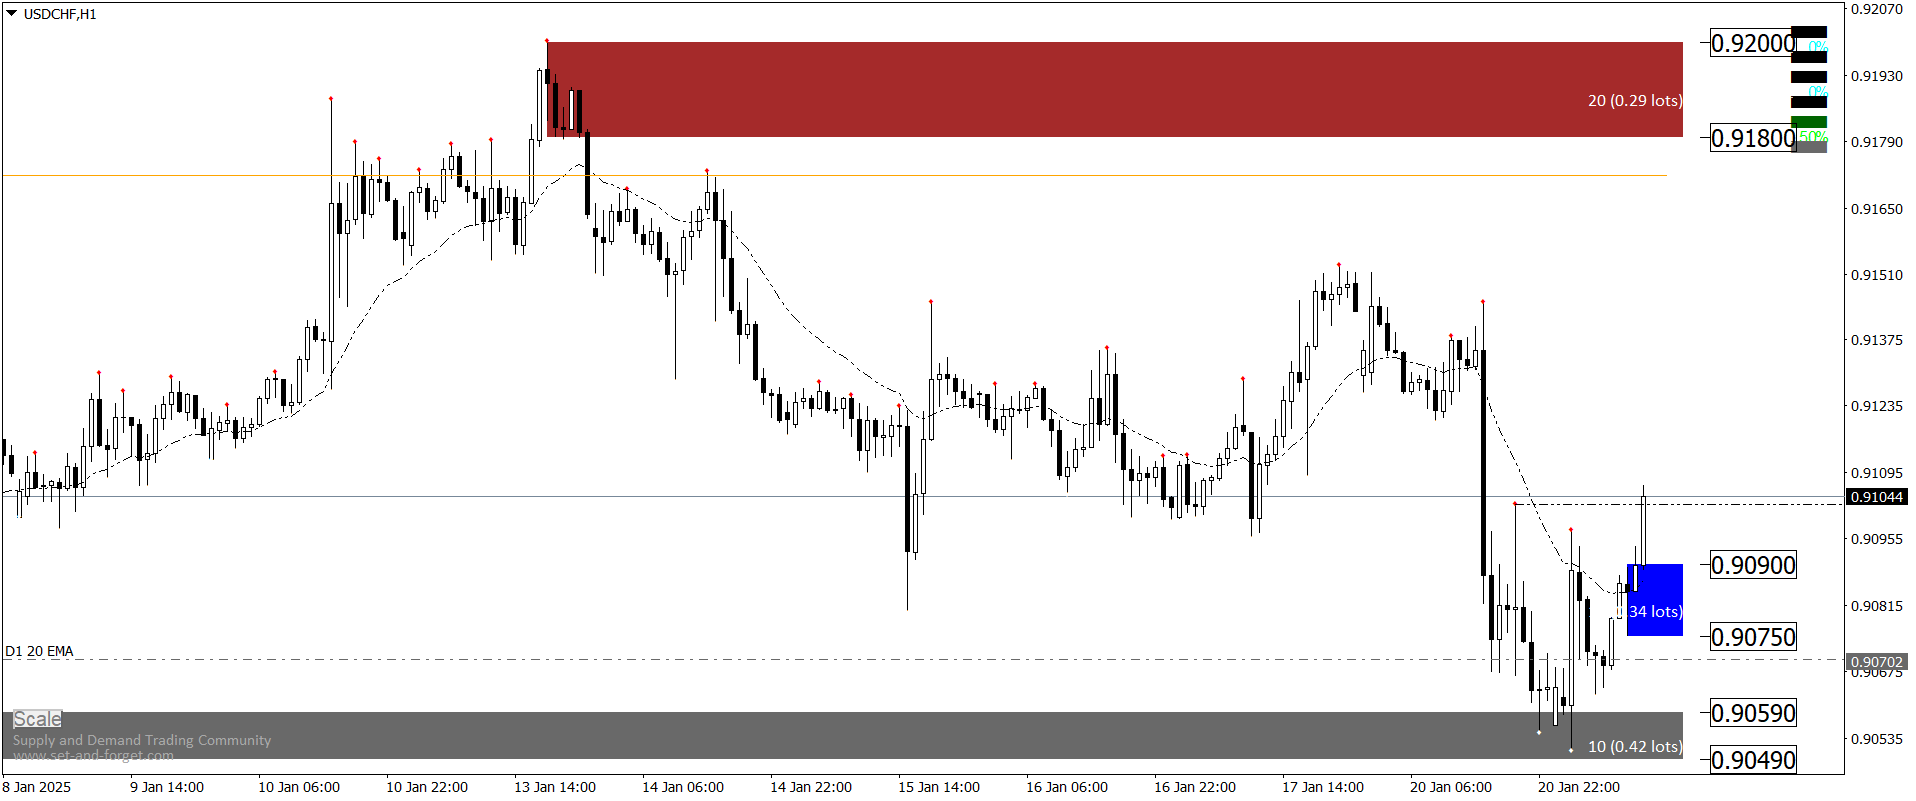
On the daily chart, USDCHF tested the supply zone around 0.91720-0.92460 levels and failed to break below 0.89970 level. This suggests that we still have a bullish momentum pushing price …
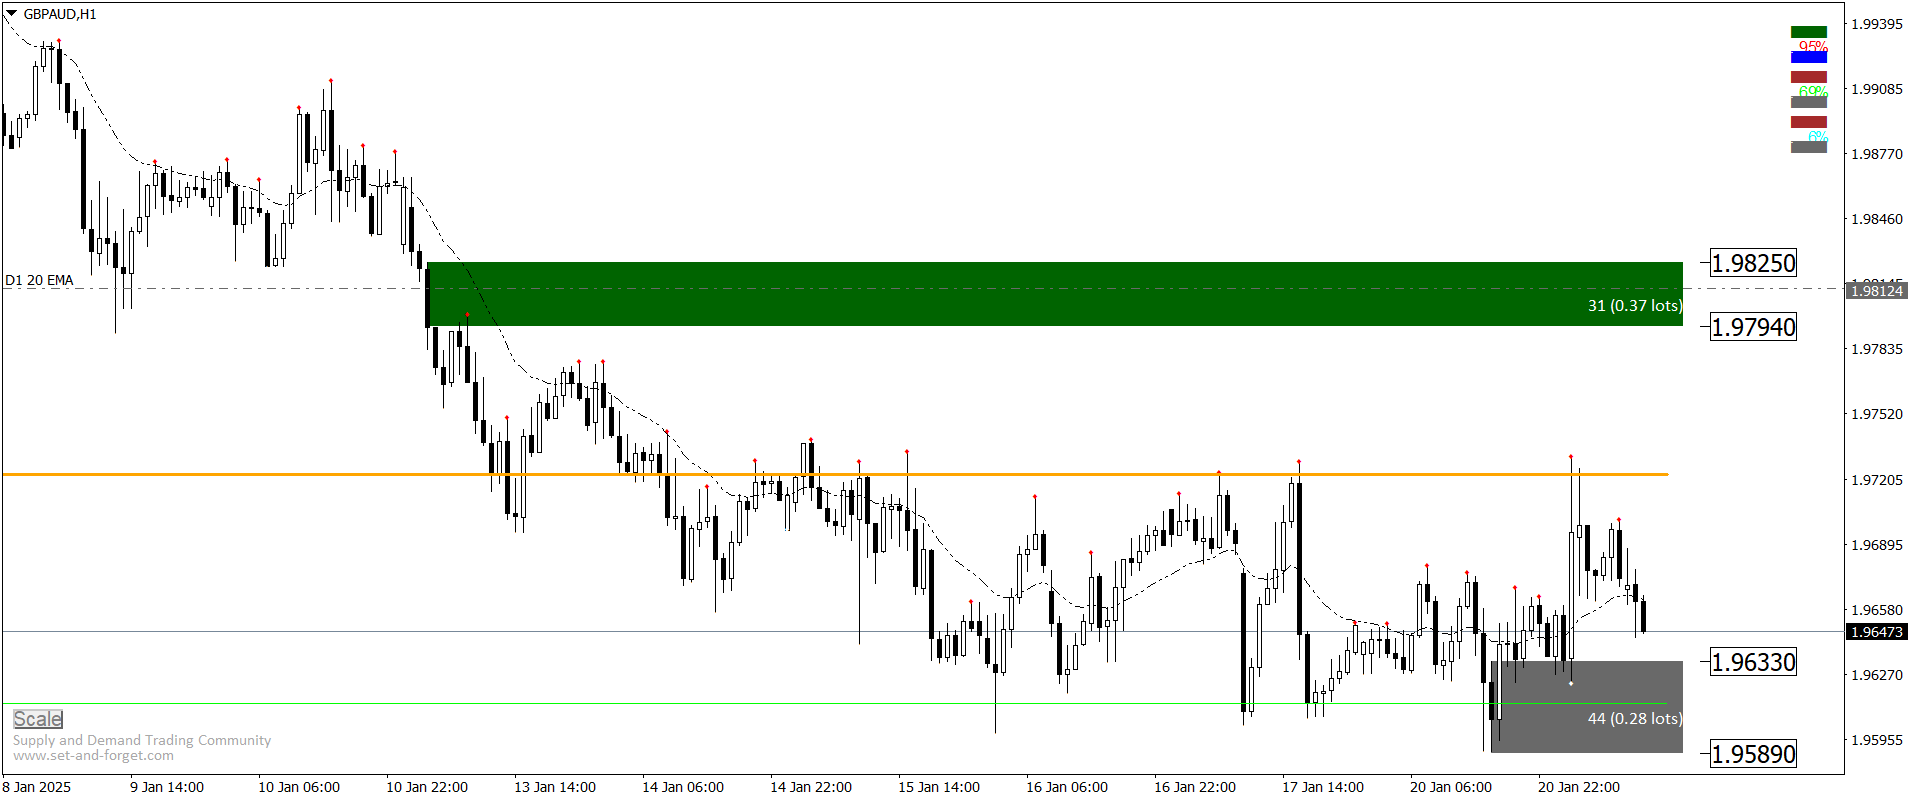
On daily chart, GBPAUD tested the daily demand zone around 1.94620 and 1.96130 levels and showed some price rejections to the upside. On H1 chart, we have a demand zone …

USDCAD on the daily chart is moving sideways for quite sometimes. If price breaks this range and shows enough bullish confirmation, we go long. On H1 chart, USDCAD created a …