Technical Analysis (TA) is a method used in financial markets to predict future price movements by analyzing historical market data, primarily price and volume.
Unlike fundamental analysis, which focuses on assessing a company’s financial health, economic conditions, and intrinsic value, technical analysis relies on price charts and trading patterns to determine market trends.
Traders who use technical analysis believe that past price movements can offer valuable insights into future price behavior, allowing them to make informed trading decisions.
By studying market trends, support and resistance levels, and various chart formations, traders aim to identify opportunities for entry and exit points in the market.
Key Principles of Technical Analysis
One of the core principles of technical analysis is the idea that market action discounts everything. This means that all publicly available information—whether economic, political, or company-specific—is already reflected in the price of an asset. Because of this belief, technical analysts consider external factors unnecessary and focus solely on market-generated data such as price and volume.
Another fundamental principle is that prices move in trends. Market prices do not move randomly; they follow identifiable trends that can be upward, downward, or sideways. Traders analyze these trends to determine the most favorable points for buying or selling. Recognizing the direction of a trend is crucial because trading in the direction of the prevailing trend increases the probability of making successful trades.
The third key principle of technical analysis is that history tends to repeat itself. Market patterns and price movements often follow similar structures because investor behavior remains relatively consistent over time. Traders rely on these recurring patterns to make predictions about future price movements, believing that human psychology and market sentiment play a significant role in shaping financial markets.
Tools of Technical Analysis
1. Charts: The Foundation of Technical Analysis
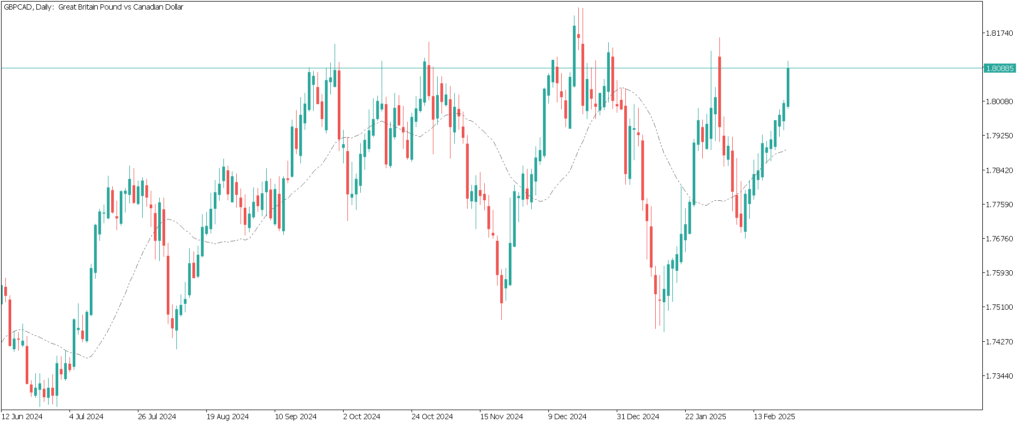
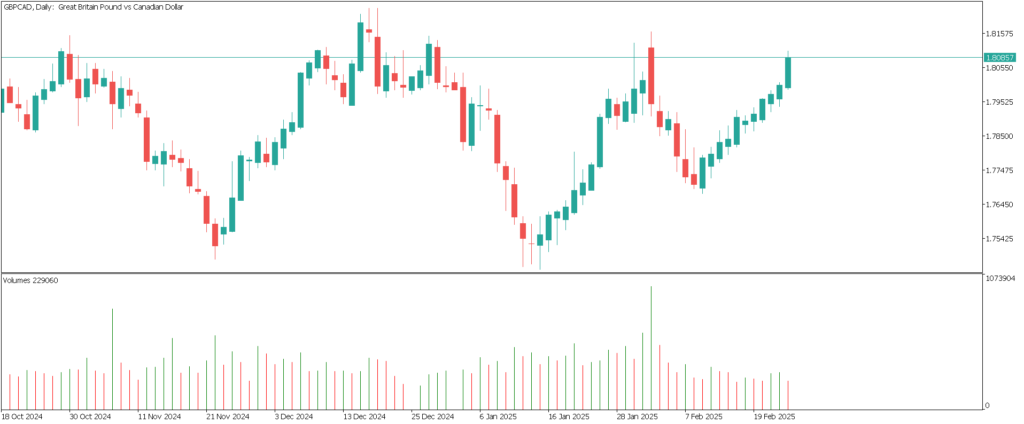
Charts are the primary tools used in technical analysis, providing a visual representation of price movements over time. Among the most commonly used chart types, the candlestick chart stands out due to its ability to display opening, closing, high, and low prices in an easily interpretable format. Candlestick charts allow traders to identify price action patterns that signal potential trend reversals or continuations.
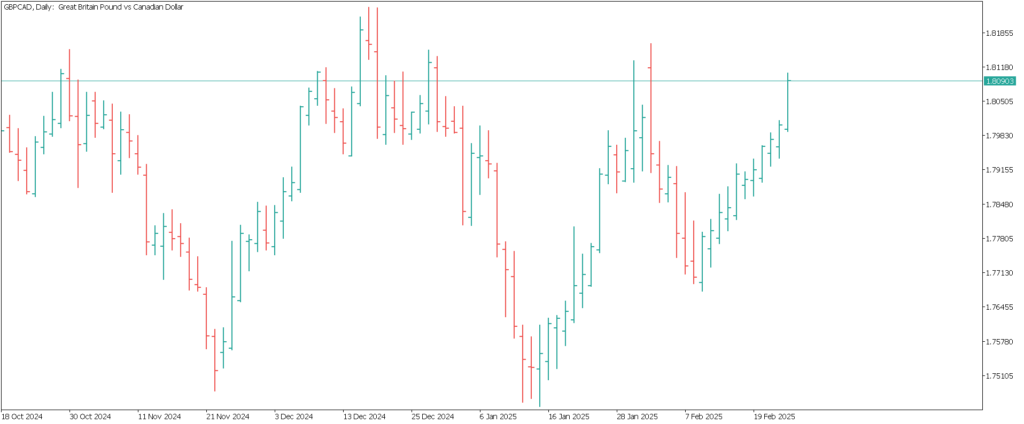
Bar charts serve a similar purpose but lack the color differentiation found in candlestick charts. They also display the high, low, opening, and closing prices for a specific period but present the data in a different visual format.
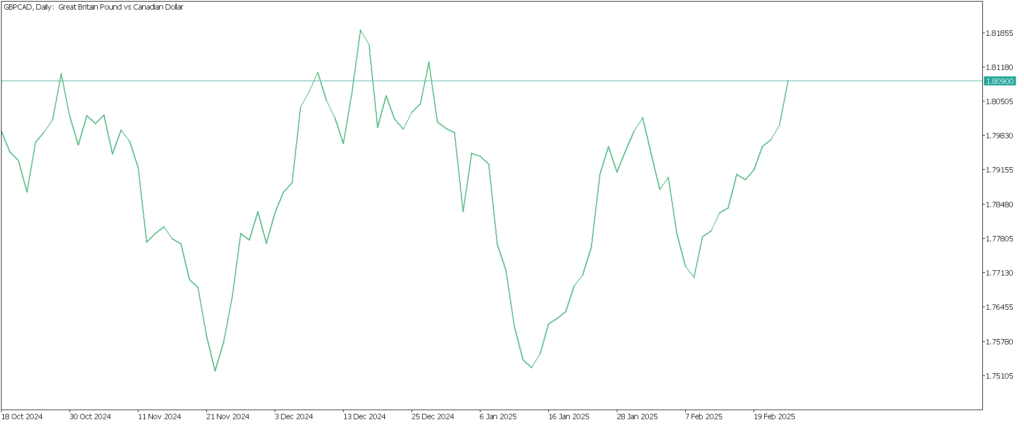
Line charts, on the other hand, offer a simplified view of price movements by plotting only the closing prices over a selected timeframe. While they do not provide as much detail as candlestick or bar charts, they are useful for identifying broad trends.
Volume charts accompany price charts and display the trading volume for a given asset. Volume is an important factor in technical analysis, as significant price movements accompanied by high trading volume often indicate stronger market sentiment, whereas low-volume price changes may lack conviction.
2. Indicators: Enhancing Market Analysis
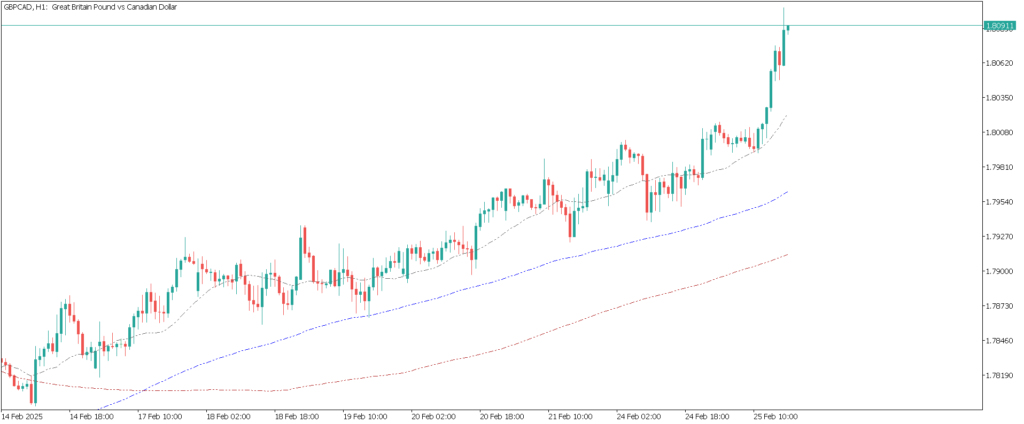
Indicators are mathematical calculations derived from historical price and volume data, helping traders confirm trends and identify potential reversal points. One of the most widely used indicators is the moving average (MA), which smooths out price fluctuations by averaging past prices over a specific period. Moving averages help traders determine the general direction of an asset’s price movement and are often used to identify entry and exit points.
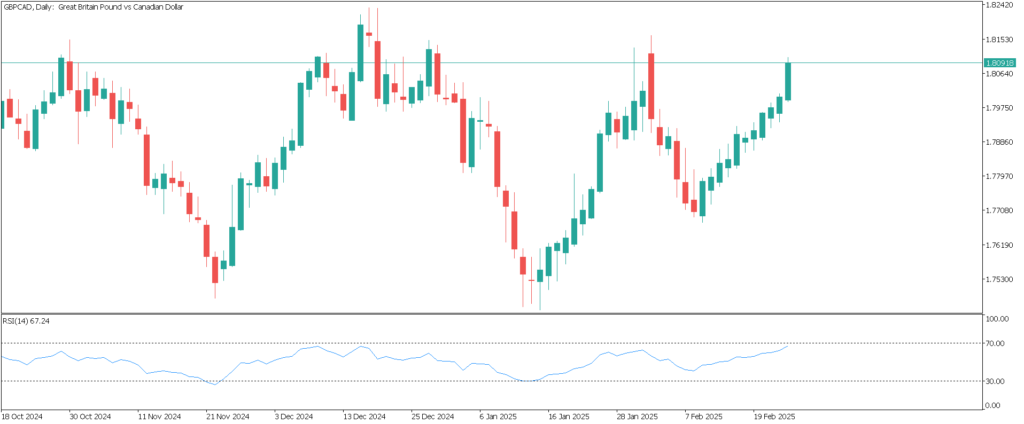
The Relative Strength Index (RSI) is another key indicator that measures the magnitude of recent price changes to determine whether an asset is overbought or oversold. An RSI reading above 70 suggests that the asset may be overbought, while a reading below 30 indicates oversold conditions, potentially signaling a reversal.
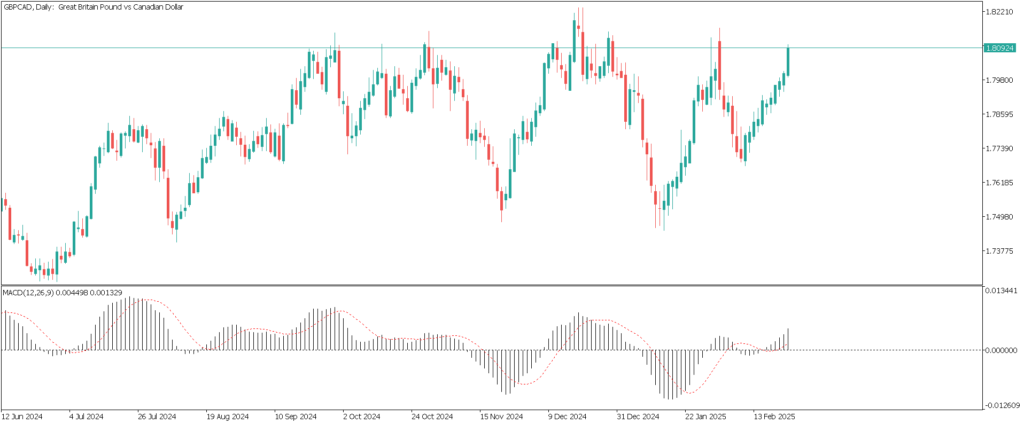
The Moving Average Convergence Divergence (MACD) is a momentum indicator that compares two moving averages to identify trend strength and potential reversals. When the MACD line crosses above the signal line, it generates a bullish signal, whereas a crossover below the signal line indicates bearish momentum. Traders use MACD to confirm trends and assess the strength of ongoing price movements.
3. Patterns: Recognizing Trading Signals
Chart patterns play a crucial role in technical analysis, providing visual cues for potential price movements:
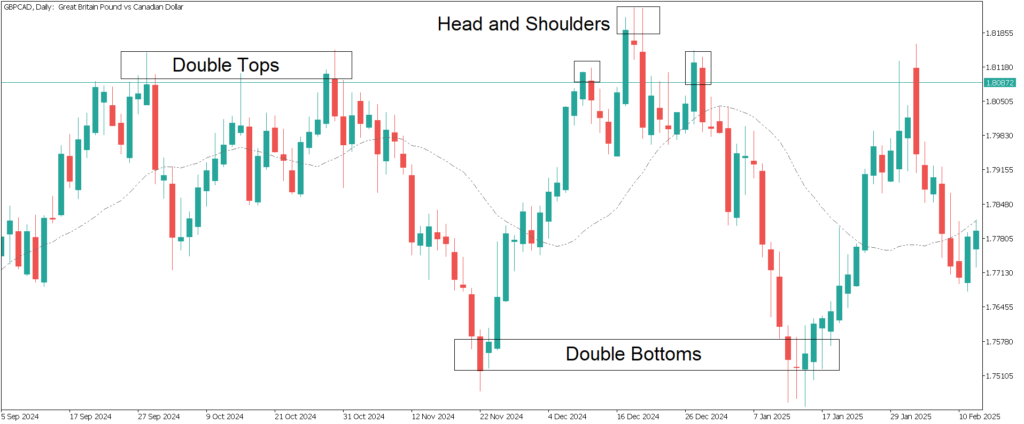
The head and shoulders pattern is a well-known formation that signals a possible trend reversal. It consists of three peaks, with the middle peak (head) being higher than the two surrounding peaks (shoulders). When the price breaks below the neckline of this pattern, it suggests a bearish reversal.
Double tops and double bottoms are also significant reversal patterns. A double top occurs when the price reaches a high level twice before declining, indicating resistance and a potential downward move. Conversely, a double bottom forms when the price reaches a low level twice before rising, signaling potential bullish momentum.
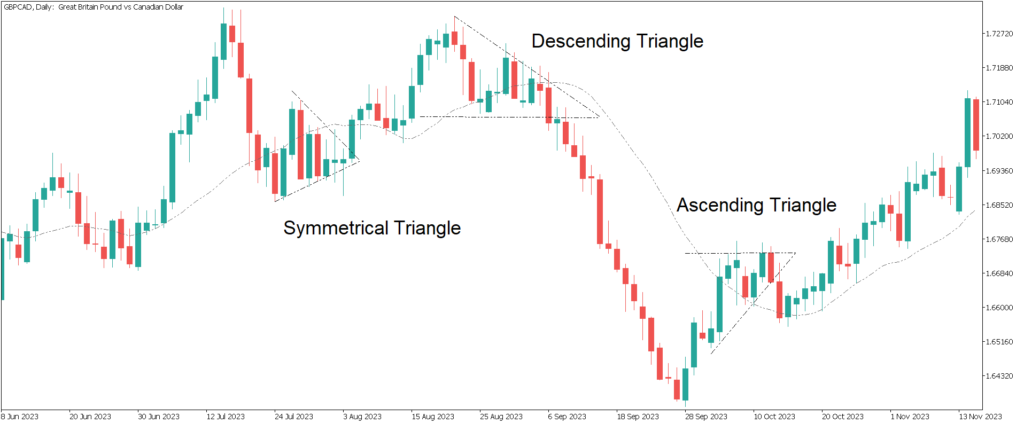
Triangles are another common chart pattern used in technical analysis. Ascending triangles typically indicate a bullish breakout, descending triangles suggest a bearish breakout, and symmetrical triangles can signal either a continuation or reversal, depending on which direction the price moves when breaking out of the pattern.
Benefits of Using Technical Analysis
One of the main advantages of technical analysis is its ability to identify trading opportunities. By analyzing price charts, traders can spot key support and resistance levels, trend directions, and momentum shifts, allowing them to enter and exit trades at optimal points.
Technical analysis also plays a crucial role in risk management. Traders use technical indicators and chart patterns to set stop-loss orders, minimizing potential losses by automatically closing trades when prices move against their positions. Identifying support and resistance levels helps traders determine where to place protective stops, ensuring that they manage risk effectively.
Another benefit of technical analysis is its versatility across different markets. Whether trading Forex, stocks, commodities, or cryptocurrencies, the principles of technical analysis remain applicable. Price patterns, indicators, and trends behave similarly across asset classes, making technical analysis a valuable tool for traders in various financial markets.
Conclusion
Technical analysis provides traders with the tools and strategies needed to analyze market trends and make informed trading decisions. By mastering price charts, indicators, and chart patterns, beginners can develop a systematic approach to trading and improve their ability to anticipate price movements.
While technical analysis is not foolproof, when combined with proper risk management and discipline, it becomes a powerful method for navigating financial markets. Aspiring traders should practice reading charts and experimenting with different technical tools to refine their skills and enhance their trading strategies.
Frequently Asked Questions (FAQ)
1. How is technical analysis different from fundamental analysis?
Technical analysis focuses on analyzing past price movements, volume, and chart patterns to predict future market behavior. In contrast, fundamental analysis examines economic indicators, financial statements, and other qualitative factors to determine an asset’s intrinsic value. While technical analysis is primarily used for short-term trading, fundamental analysis is often applied to long-term investing.
2. Can beginners use technical analysis effectively?
Yes, beginners can learn and apply technical analysis effectively with proper education and practice. Understanding basic chart patterns, indicators, and trend analysis can help new traders make informed decisions. However, like any trading strategy, technical analysis requires time, discipline, and experience to master.
3. What are the most commonly used technical indicators?
Some of the most popular technical indicators include Moving Averages (MA), Relative Strength Index (RSI), and the Moving Average Convergence Divergence (MACD). Moving Averages help identify trends, RSI indicates overbought or oversold conditions, and MACD measures momentum and potential trend reversals.
4. Does technical analysis work in all financial markets?
Yes, technical analysis can be applied to various financial markets, including stocks, Forex, commodities, and cryptocurrencies. Since price movements in all markets follow patterns influenced by supply and demand, technical analysis remains a useful tool regardless of the asset being traded.
5. Can technical analysis guarantee profitable trades?
No, technical analysis does not guarantee success or profits. While it provides traders with tools to improve decision-making, no method can predict market movements with absolute certainty. Risk management, discipline, and a well-defined trading plan are essential to achieving consistent results in trading.